Returns a ggplot object of a specific graphic explicitly called by name from the ones included in the specimens
Source:R/70_plotup.R
plotup.RdReturns a ggplot object of a specific graphic explicitly called by name from the ones included in the specimens
plotup(data, vars, diagram, output = "plots pane", dir = tempdir())Arguments
- data
Data.frame. Default dataset to use for plot. If not already a data.frame, it should be first coerced to by [as.data.frame()].
- vars
Character. A variable within the dataset.
- diagram
Character. A specific graphic to be presented within the ones considered by the 'logical', 'ordered', 'factor', 'character', 'datetime' and 'numeric' arguments of the 'wideplot()' function.
- output
Character. Type of output.
'html': Creates and displays a html file with the specific graphic.
'plots pane': Default output, a ggplot2 object in RStudio's plots pane.
'console': Prints the code that produces the specific graphic.
- dir
Directory in which the files are stored.
Value
This function returns a c('gg', 'ggplot') object, but if the 'output' argument is set to it 'html' or 'console', the function cause a side-effect: either creating and displaying a temporary html file, or printing the ggplot2 code to the console.
See also
Specimens of graphics for univariate and bivariate data.
Examples
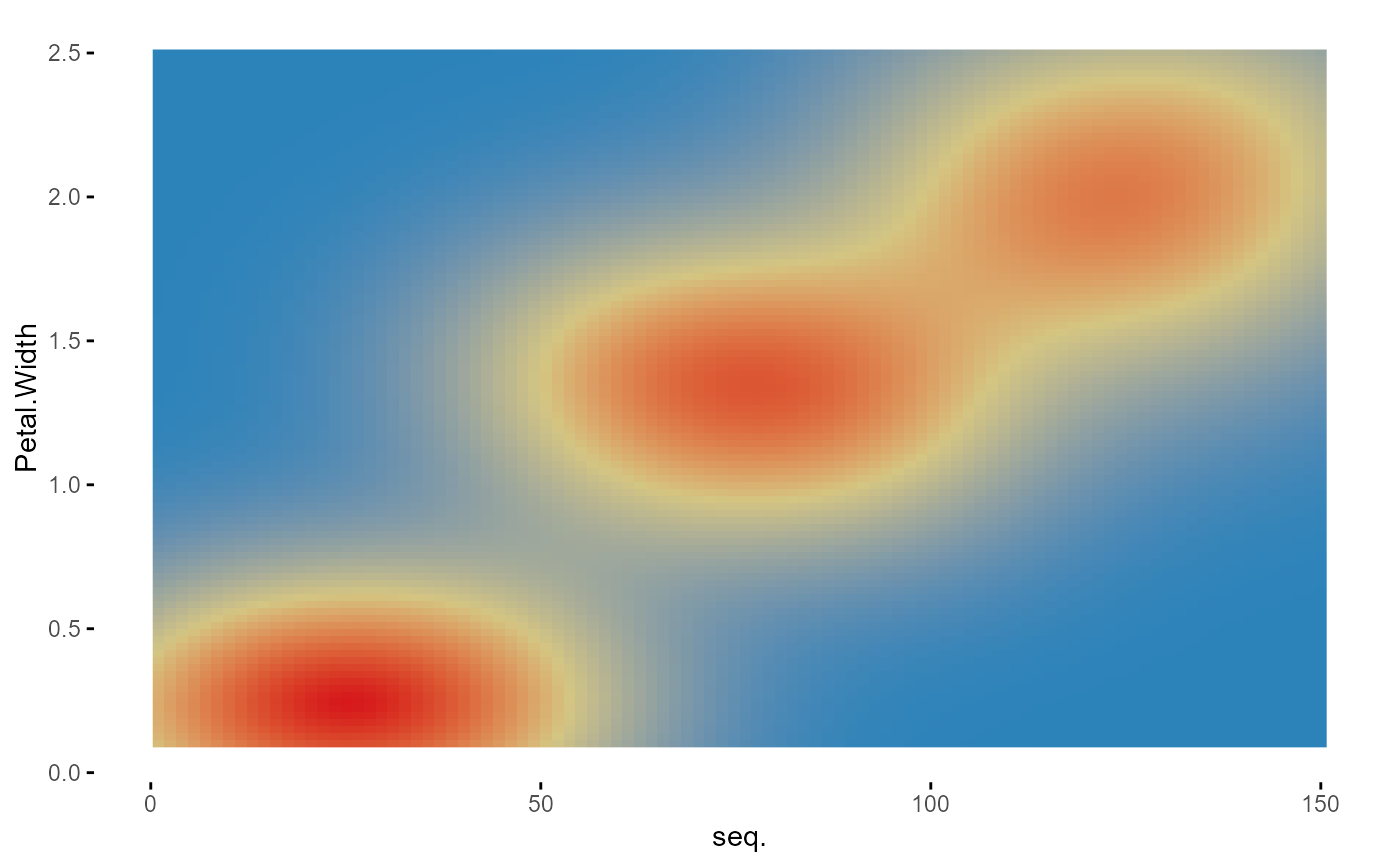
plotup(iris, "Petal.Width", "color heatmap")

plotup(iris, "Petal.Width", "color heatmap", output = "console")
#>
#> ggplot(iris, aes(y=Petal.Width)) +
#>   stat_density_2d(aes(x=seq_along(Petal.Width), fill = stat(density)), geom = 'raster', contour = FALSE) +
#>   scale_fill_gradientn(colours = colorRampPalette(rev(RColorBrewer::brewer.pal(4, 'Spectral')))(3)) +
#>   labs(x='seq.') +
#>   theme_minimal() +
#>   theme(panel.grid = element_line(colour = NA),
#>     axis.ticks = element_line(color = 'black'),
#>     legend.position='none')
if (interactive()) {
plotup(iris, "Petal.Width", "color heatmap", output = "html")
}
plotup(iris, "Petal.Width", "color heatmap", output = "console")
#>
#> ggplot(iris, aes(y=Petal.Width)) +
#> stat_density_2d(aes(x=seq_along(Petal.Width), fill = stat(density)), geom = 'raster', contour = FALSE) +
#> scale_fill_gradientn(colours = colorRampPalette(rev(RColorBrewer::brewer.pal(4, 'Spectral')))(3)) +
#> labs(x='seq.') +
#> theme_minimal() +
#> theme(panel.grid = element_line(colour = NA),
#> axis.ticks = element_line(color = 'black'),
#> legend.position='none')
if (interactive()) {
plotup(iris, "Petal.Width", "color heatmap", output = "html")
}